What mood tracking actually is
Mood tracking is the habit of recording how you feel at roughly the same cadence — usually once a day — in a form you can look back over. The single reading is almost worthless; the point is the series. Memory is a terrible historian of mood: it overweights the last few days and the worst moments, which is why “how was your month?” gets answered with whatever happened on Thursday. Thirty honest data points beat one strong impression.
Clinicians have used the paper version (mood diaries) for decades, both to spot patterns and because the record makes conversations with a professional concrete. The app version adds the part paper is bad at: showing you the shape of the data.
What to log (less than you think)
The biggest tracking mistake is logging too much. Rating mood, sleep, energy, anxiety, weather, diet and exercise daily is a research project, not a habit — and it collapses in week two. A sustainable log is three fields, two of them optional:
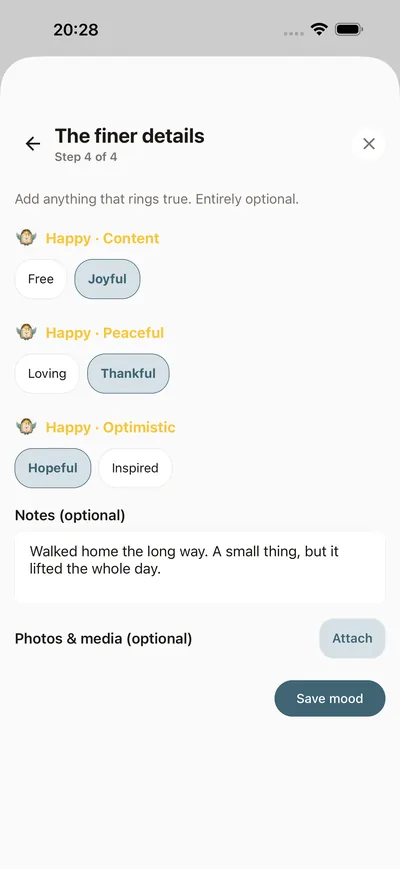
- A mood level — one reading on a simple scale. This is the non-negotiable core, and it takes five seconds.
- A named feeling (optional but powerful). “Bad” is a level; which bad — anxious, let down, drained, bored — is information. Precision is where patterns come from, and it is exactly what a feelings wheel is for.
- One line of context (optional). Not an essay — a tag-like note: “deadline week”, “slept badly”, “saw friends”. Future-you needs the label, not the story; if you want the story too, that’s journaling, and the two work best combined.
Reading the patterns
After three or four weeks, look for three shapes — and hold them all loosely:
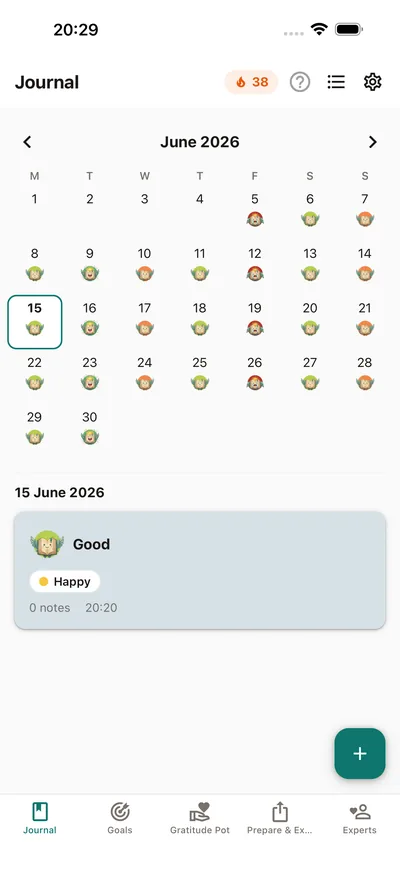
- Cycles. Day-of-week effects are the most common find: the Sunday-evening dip, the Tuesday trough, the Friday lift. Knowing a dip is structural changes how you read it when you’re in one — it stops being evidence that life is going wrong.
- Companions. What shows up next to the low days? Short sleep, a particular meeting, three days without leaving the house? A correlation is a hypothesis, not a verdict — but it tells you what experiment to run next week.
- Drift. The slow slide a person inside it can’t see: this month’s baseline sitting one notch below last month’s. Catching drift early is arguably the strongest practical case for tracking at all — it turns “I’ve been off lately, I think?” into something you can see, act on, and if needed bring to a professional as an actual record rather than a vague impression.
From a month of dots to a story: insights
Charts show you that something changed; they don’t say what it might mean. That’s the job of a periodic review — sitting down with a month of entries and asking what actually happened. Doing it by hand works (read the month, note the three biggest events, the best and worst week, one pattern worth testing), and doing it at all is the part most people skip.
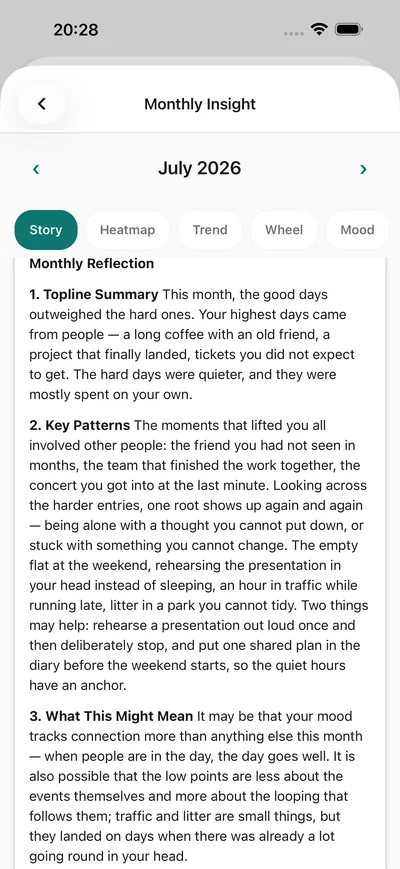
BrightLog automates the sit-down: monthly and yearly insights read the period’s entries — mood check-ins and their notes included — and your goals, and write back a plain-language story in seven parts: how the period went, the patterns in it, what they might mean, your strengths, one small habit to try (the pattern, the small change, when to do it), a short action plan and a checkpoint for next time that builds on your goals — or, with none yet, suggests a small one you can create in a few taps. Below the story, a Goals block counts the goals you worked on and your check-ins. Every insight says when it was written and from how many entries; add entries afterwards and it offers an Update rather than changing under you, and once a day you can have it written again, with the previous version kept to compare. Two things matter here. First, it is written only when you ask for it. Second, treat it as a first draft of your month, to agree or argue with — a summary, not an assessment — a quick route from a pile of dots to something worth acting on. And if you’re seeing a professional, the same machinery goes one step further: a session-preparation summary you can bring to your psychologist, clearly marked as not a diagnosis.
The pitfalls, including the real one
- Grading instead of reporting. The log is a measurement, not a performance review. A low score is a data point, not a failure — the moment logging a bad day feels like admitting something, honesty (and the data) dies.
- Over-interpreting a week. Seven points is noise. Patterns earn trust at a month; a single odd Tuesday means nothing.
- The real one: tracking can turn into symptom-watching. For some people, especially with health anxiety, constant self-measurement amplifies the thing it measures — checking becomes the symptom. The tell is dread around logging. The fix is a lighter dose (every other day, or a weekly review) or a pause; a tool should serve you, and a mood tracker is no exception — BrightLog’s check-in never asks for more than a level, a missed day costs one monthly freeze rather than the streak, and after a bad day its daily nudges turn gentle instead of asking for more. And plainly: a self-tracker is self-knowledge, not diagnosis or treatment — persistent low readings are a reason to talk to someone qualified, with your chart in hand.
What a good mood tracker needs
Four things, in order:
- Speed. If a log takes more than about ten seconds, week three doesn’t happen. Speed is what keeps a mood diary alive.
- An emotional vocabulary, so “bad” can become “let down” when you have two extra seconds — level plus name is where the insight density is.
- A view of the series. Month at a glance, trends, the companions of your low days — the reason to log is to eventually look.
- Privacy you can verify. A mood log is a medical-adjacent record of your worst days. Where is it stored? Who can technically read it? What reaches any AI? Those questions deserve plain answers from any app — our guide to choosing a mood journal app lists them, and the checks to run before you commit.
BrightLog’s answers, for the record: two taps to log, the full 82-emotion wheel a tap or two deeper, and, to see the series, the calendar plus five Insights views — Story, Heatmap (your year laid out as a grid of colour), Trend, Wheel and Mood — four of them with no sign-in at all. Your information never leaves your device, and a backup, only if you choose one, goes to your own iCloud or Google Drive. A Check in nudge can open the check-in for you during the hours you set, and with the home-screen widgets, logging starts before the app is even open — the Daily Mood widget preselects your level from the home screen.